Double Top Chart Pattern: Key Strategies for Bearish Reversals
Master the double top pattern with our extensive guide and learn how to trade these bearish reversals.

Double top chart patterns are renowned for their reliability in predicting bearish reversals. This comprehensive guide will explore how to identify and effectively trade this pattern to optimise your trading outcomes.
What is a Double Top Chart Pattern?
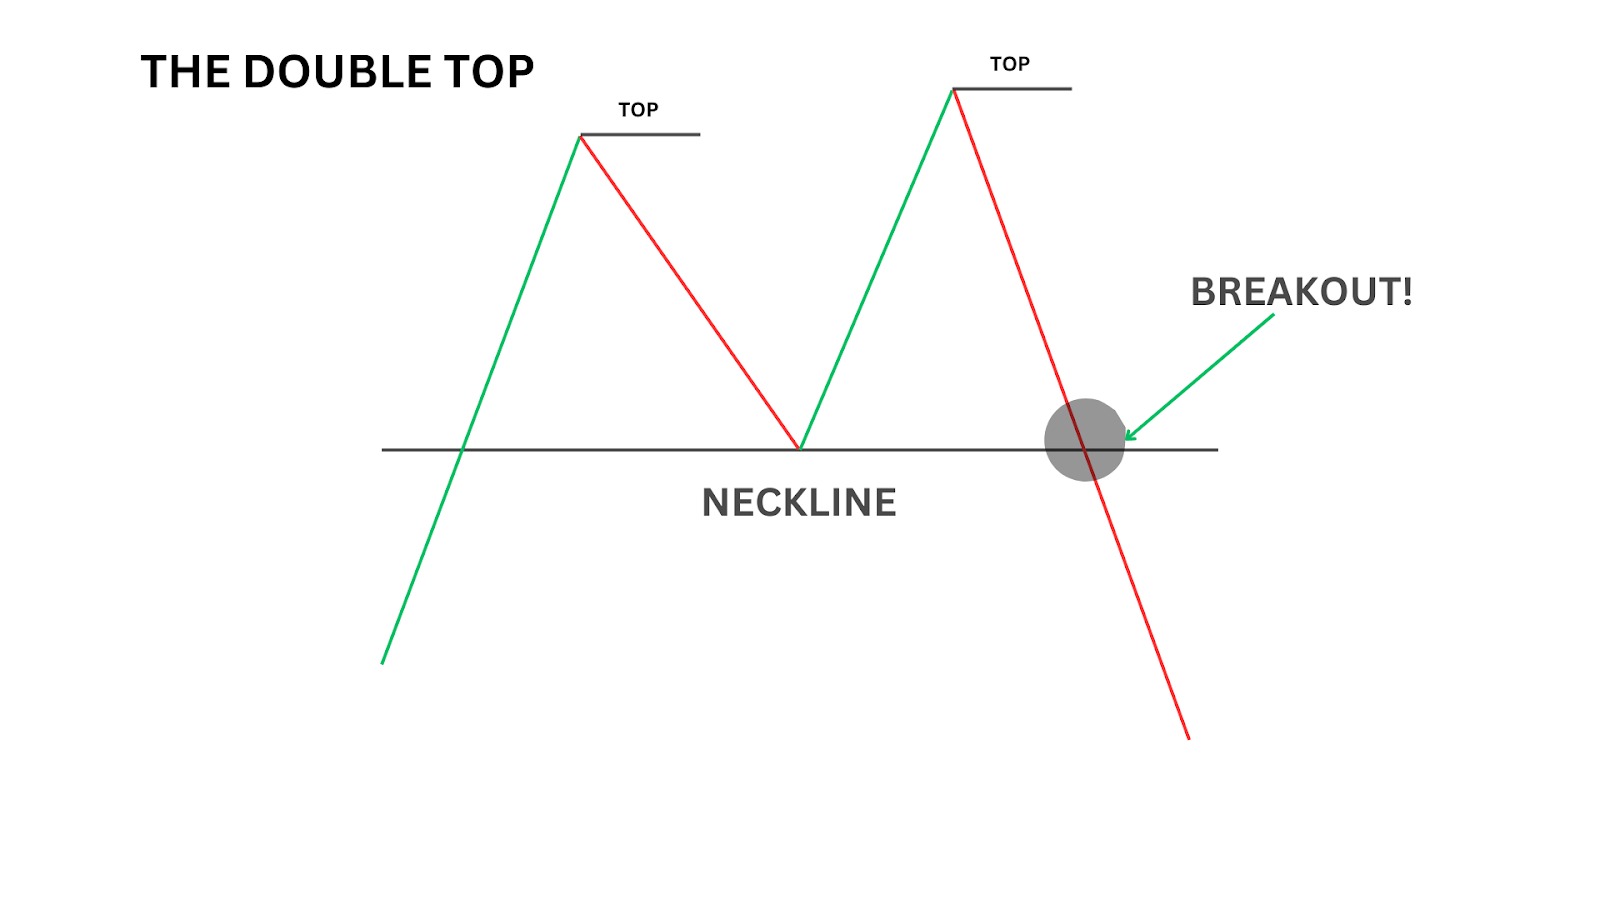
Double top chart patterns are highly regarded bearish technical reversal patterns that emerge when a financial asset reaches a high price on two separate occasions, and sees a sell-off both times from the highs.

It signifies a shift in momentum and is confirmed when the asset price drops below a support level that aligns with the low point between the two previous highs. This pattern consists of two peaks, creating a potential trend reversal signal.
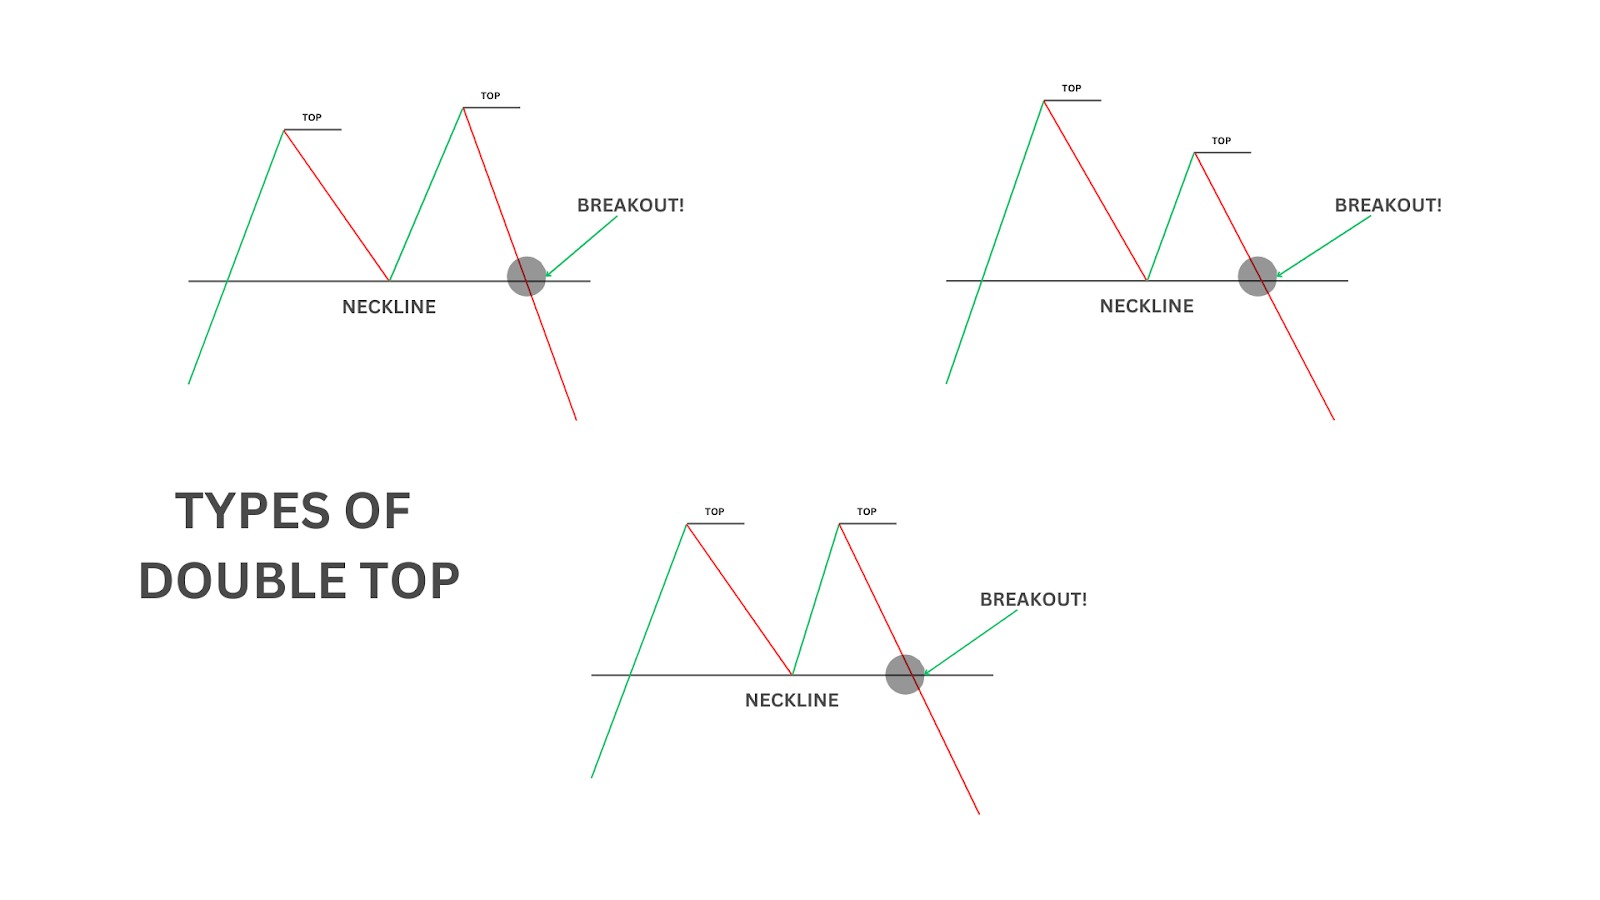
Remember: both peaks don’t have to be exactly the same. Sometimes, the first peak goes higher; sometimes, the second peak goes higher; sometimes, they are exactly the same!
The important thing is that there are two peaks around the same price level, creating a significant rejection to the downside and forming an “M pattern.”
When price moves back down through the level the second peak bounced from, it has broken the ‘neckline’.

For the double top pattern to play out correctly, price should then continue in a downward direction toward the measured move – which is the distance from the highest peak to the neckline, mirrored below the neckline as shown in the image below.

Let’s look at some other vital characteristics of the double top.
Characteristics of a Double Top Pattern
Formation: Consists of two consecutive peaks of similar height, followed by a break below support level. Can sometimes be confused with the head and shoulders pattern.
Psychology: Bulls were unable to push the price past a certain point on two occasions, leading to buyer exhaustion and an eventual collapse in price.
Confirmation: The pattern is confirmed when the price falls and closes below the support level, known as the neckline.
Examples of Double Top Patterns

As you can see, no two double tops are the same. They can appear on all timeframes, marking the peaks of uptrends and downtrends as a consolidation to continuation pattern, or have mini-double tops inside the larger double tops – such as in our USOIL example.
Let’s take a closer look.

Case Study: Daily Double Top on BTC/USD
Understanding real-life instances of double top patterns can significantly enhance your ability to spot and trade them. Let’s look at a great example – the most famous and recent Double Top pattern on Bitcoin.

From 2020 to 2021, Bitcoin experienced a massive bull run from a mere $5,000 dollars to nearly $70,000!
The double top pattern we are looking at occurs when the first peak hit $67,000 and the second peak reached $69,000. Once Bitcoin broke the neckline support at $58,000, it fell all the way to $15,460 – a massive bearish reversal that has devastated many, but not if you were wise to the double top bearish reversal pattern.
Notice first how after Bitcoin formed its first peak, it retraced all the way to $58,000 forming the first leg down (downside of first peak). For experienced traders looking for a double top pattern at the highs, this was the first warning sign that a double top could be at play.
Once it got rejected from similar highs in the second peak – waiting for a neckline break would have been an exciting prospect for short-sellers.
How Can You Trade Double Tops?
Trading double tops is a great strategy for any trader – and there are many ways to do so. The most beginner-friendly way is by first observing the pattern, then only entering a short trade when the double top signals a confirmation of a breakout.
There are many ways to confirm the breakout, but the most basic method is to wait for a candle to close under the neckline.
Method One: Wait for a Close Below the Neckline
To trade the double top pattern effectively, start by identifying the first peak when the price reaches a new high and then begins to decline. After a brief recovery, observe the second peak, noting whether the price attempts to reach a new high.
This second peak may match, exceed, or fall just short of the first, but what’s important is recognising signs of exhaustion in the price action – ask yourself, is the price struggling to push higher?
Once the price begins to fall again, wait for confirmation of the pattern by watching for a break below the neckline.
A decisive close below this support level signals the formation of the double top and presents an opportunity to look for short entries.

Our 1:2 partials risk-to-reward (RR) setup may seem a bit unconventional for trading a double top, but it addresses a few critical issues that beginners often face.
This approach involves setting two take-profit (TP) levels. First, set a partial TP at 1:1, which can be 50% or 75% of your position. Then, move your stop loss to your entry and set a second TP at 1:2.
The partial TP allows us to remain in profit, even if the second target isn’t reached. If both targets are reached, this setup is effectively a 1.5 RR trade, which allows us to remain at breakeven with a 40% win rate.
With a 1:1 risk-to-reward (RR) ratio, you’d need a 50% win rate just to break even, with potential losses from commissions and spreads.
This strategy helps you strike a strong balance between the win rate and profitability across a series of trades.
Trading Strategy Summary:
- Entry Point: Set a short limit position at the neckline once the price breaks below the neckline. Wait patiently for it to return. If it goes without you, DO NOT chase price action.
- Stop-Loss: Place a stop-loss just above the second peak to minimise potential losses.
- Profit Target: Set take profits at the measured move target of 1:1, and at a fixed 1:2 risk-to-reward (RR) away.
| Advantages: Ensures profitability even with a lower win rate, balances risk and reward with a combination of conservative and aggressive profit targets. |
| Disadvantages: Potential missed profits if price continues to move beyond the 1:2 TP, requires managing multiple exits, which can complicate trade execution. |
Method Two: Trading Double Top with RSI Divergence
To take a more aggressive approach to trading the double top pattern, carefully monitor the price as it declines from the second peak.
The key is to recognise when the price drops below the level of the first peak, indicating weakening momentum.
At this stage, indicators such as RSI divergence and volume can hint at the potential formation of a double top. RSI divergence, in particular, suggests that buying pressure is weakening, even if the price continues to rise, offering early confirmation of a potential reversal. We can see this through bearish divergence.

This early indication allows traders to enter a short trade as the price moves toward the neckline. By taking partial profits at the neckline, traders can reduce risk and potentially hold the remaining position without further risk, having already locked in gains.
Traders can also look for a secondary entry on a break of the neckline or during a retest of the neckline for additional opportunities to capitalise on the downward move.
As always, proper stop-loss placement just above the second peak is essential to protect against a potential rebound or invalidation of the bearish pattern.

Since this strategy is more aggressive, utilising stop-losses and sound risk management is crucial. In case the bearish divergence does not play out, and the price forms a Triple Top or Rising Wedge instead, risking less on such trades can safeguard your capital.
Another way to minimise risk, is to take profits off at 2RR, 3RR, 4RR and 5RR – or to trail your stops on the way to the full extended move at the horizontal support market out (5.7RR).
Trading Strategy:
- Entry Point: Initiate a short trade immediately when the price descends below the height of the first peak during the formation of the second peak.
- Stop-Loss: Set the stop-loss slightly above the second peak to minimise exposure to sudden market moves.
- Profit Target: Have set profit targets at regular intervals towards the target horizontal support/liquidity. In this case, 2RR, 3RR, 4RR, 5RR and 5.7RR (swing low target)
| Advantages: Early entry allows for potentially larger profits by capturing the full downward move.RSI divergence provides additional confirmation of weakening momentum, enhancing trade confidence. |
| Disadvantages: Higher risk of a false move if the bearish divergence does not play out, requires more active management and risk control due to the early and aggressive entry. |
Closing Thoughts on the Double Top Pattern
The Double Top formation is a classic bearish chart pattern that every trader should know about. It not only signals a great shorting opportunity, but alerts traders in long positions to exit their positions.
Here are some advantages and disadvantages to keep in mind when trading this pattern.
Advantages of Trading the Double Top
- Reliable Reversal Signal: The double top pattern is highly regarded for its ability to indicate a potential reversal within a strong uptrend, offering traders a clear signal to consider exiting long positions or entering short ones.
- Volume Confirmation: Observing trading volumes can provide additional confirmation. Increased volume at the first peak and diminished volume at the second peak suggest weakening upward momentum, reinforcing the likelihood of a reversal.
- Technical Indicator Support: Incorporating indicators like RSI or Bollinger Bands can further enhance the reliability of the pattern by identifying momentum shifts or divergences that support the double top’s bearish implications.
Disadvantages of Trading the Double Top
- Risk of False Breakouts: The pattern may sometimes present false signals, particularly if the neckline break lacks a decisive close, leading to potential losses if the price action reverses unexpectedly.
- Limited Reward Potential: Although reliable, the double top pattern does not always offer the largest risk-to-reward setups, which may limit profit potential compared to other trading strategies.
- Breakouts May Not Be Clean: After breaking the neckline, the price may fluctuate unpredictably, wicking back and forth/consolidating near the neckline, making it hard to confirm the double top breakout.
A great trader has many strategies in their playbook. Now, you have another powerful tool in your trading arsenal! Use the double top pattern to spot and trade potential reversals – and get funded up to $400k in starting capital while you do!
FAQs
What is a Double Bottom Pattern and is it like the Double Top?
A double bottom pattern is the opposite of a double top and is a bullish reversal pattern that occurs after an extended downtrend. This pattern consists of two consecutive lows of similar depth, followed by a breakout above a key resistance level. It signals a potential shift in momentum from bearish to bullish and is confirmed when the price breaks above the resistance level.
How is the Double Bottom Pattern Formed?
The double bottom formation starts when the price reaches a low, rebounds, and then declines again to a similar level before making a more sustained move higher. The pattern forms when the price fails to break lower on the second dip, indicating that sellers are losing control, and buyers are beginning to take over. The double bottom formation is confirmed once the price breaks above the previous resistance level formed by the peak between the two lows.
What are the similarities between Double Tops and Double Bottoms?
Both double top and double bottom patterns are recurring patterns in technical analysis that signal a trend reversal. While a double top indicates a potential shift from a bullish to a bearish trend, a double bottom signals a shift from bearish to bullish. Both patterns involve the price reaching similar highs or lows twice before breaking through a significant support or resistance level.


